
6 INEVITABLE Stock Market Downturns

In the world of stock trading, and crypto trading, volatility is as much a part of the landscape.
Whether you’re a day trader or a long-term investor you’re bound to undergo different degrees of stock market downturns, drops and crashes.
And each level of downturn has its own set of characteristics, challenges, and strategies for recovery.
Let’s dive into the nuances of market downturns, so you can navigate these stormy waters with confidence and savvy.
📊 DOWNTURN #1: Down -2% — A Ripple of Volatility
Think of a -2% drop like your morning coffee spilling a bit—annoying, but not catastrophic.
This kind of dip is usually a short-term blip and part of normal market movement. It often corrects itself quickly.
🔄 DOWNTURN #2: Down -5% — The Pullback Perspective
A 5% drop is often called a pullback. It might rattle your nerves, but it doesn’t usually signal a long-term trend.
Zooming out to a bigger time frame can help you keep perspective.
🛑 DOWNTURN #3: Down -10% — Entering Correction Territory
A 10% dip is officially known as a market correction.
This is where the uptrend pauses, moving averages start crossing down, and medium-term trends show downside momentum.
It’s often a time when traders look for short opportunities and aim to profit from the correction.
🐻 DOWNTURN #4: Down -20% — The Bear Market Looms
This is bear market territory.
When markets fall 20% or more, it’s time to get cautious.
Investors often shift toward defensive sectors like utilities and consumer staples, which are less impacted during economic slowdowns.
⚠️ DOWNTURN #5: Down -50% — The Market Crash Crisis
A 50% plunge is like a financial earthquake—rare but devastating.
We’ve seen this during:
-
The 2008 financial crisis
-
The dot-com bubble
-
The oil crisis
💡 Silver Lining:
History shows that markets do recover. After every crash, we’ve eventually seen a comeback to new all-time highs.
🌧️ DOWNTURN #6: Prolonged Downside — The Depression
This isn’t just a steep drop—it’s a long-term economic downturn with no clear percentage marker.
The most famous example?
The Great Depression (1930s), where:
-
Unemployment soared to 25% in the U.S.
-
Industrial production, incomes, and prices collapsed
-
The effects lasted years, not months
It’s different from a recession—this is deeper, longer, and much more painful.
🧭 Conclusion: Steady as She Goes
As I always say:
Downtrends, downturns, and downside will come.
But being informed and prepared puts you ahead of the curve.
Whether you’re hedging, shifting sectors, or taking advantage of short opportunities, there is always a way forward.
✅ With the right mindset and strategy, you won’t just survive—you’ll thrive.

Trade well, live free.
Timon Rossolimos
Founder, MATI Trader
CONNECT WITH US:
Facebook Group:
http://www.facebook.com/groups/matitrader
Website:
https://timonandmati.com
FREE MATI Trader Chat Room – Discord:
https://discord.gg/c8f37kyv35


Order via our secured website:
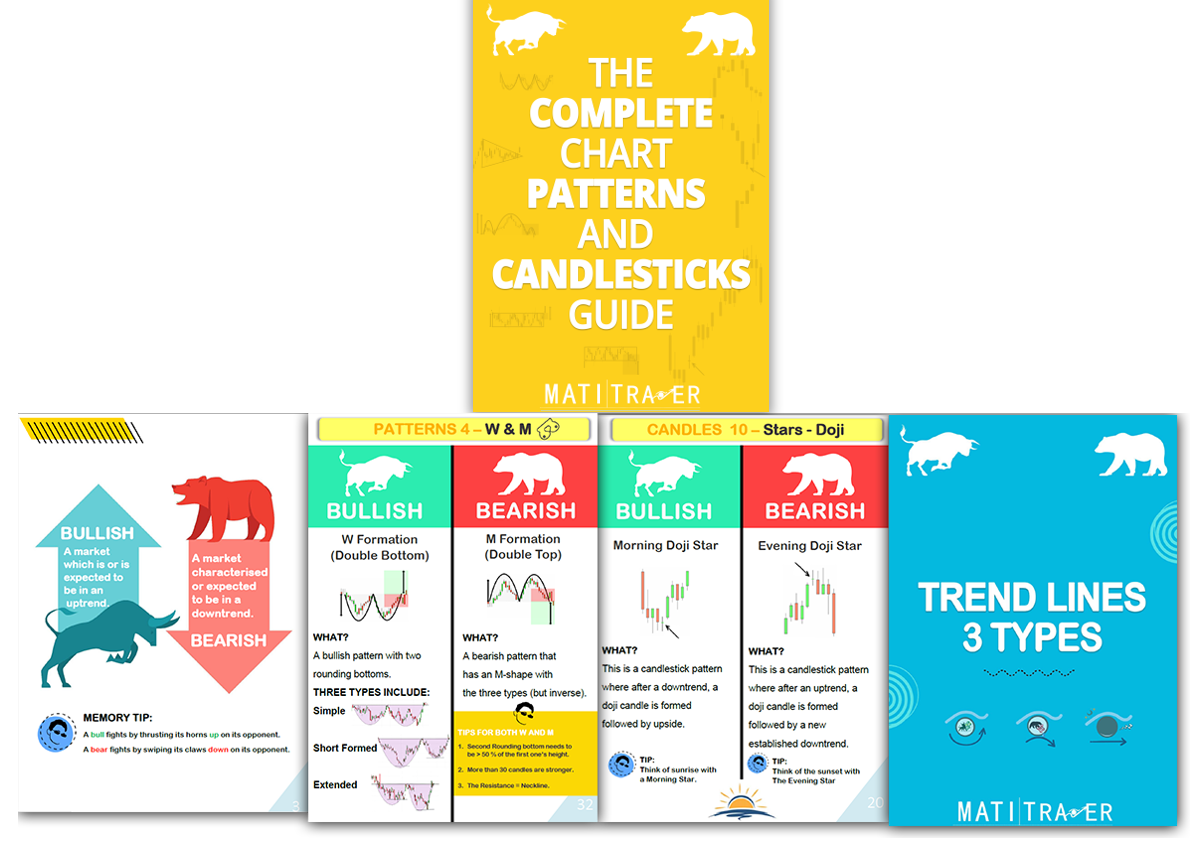
Click here to order The Complete Charts Patterns and Candlesticks Guide by MATI Trader book
Or order via EFT payment”
Click here to order the book via EFT (all info in the invoice).
Enjoy and remember…
You won’t need to buy or order another book on chart patterns and candlesticks ever again as I will be updating it very often and will let you know.
Trade well, live free.
Timon Rossolimos
Founder, MATI Trader
Not sure the best way to get started with MATI Trader?
Follow these steps to start your successful trading journey.